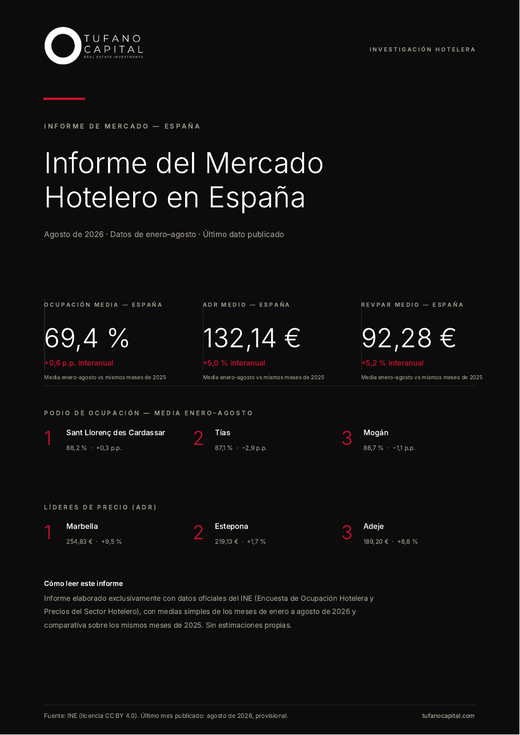
Occupancy, average daily rate (ADR), revenue per available room (RevPAR), travellers and overnight stays in Spain's main urban markets and holiday destinations. Data updates automatically every month. Click each indicator to see it in the charts.
Barcelona (province) PDF ↓
Occupancy ADR (average daily rate) RevPAR (revenue per available room) Travellers Overnight stays
Monthly evolution: 2026, 2025 and 2023-2025 range
Madrid (Community of Madrid) PDF ↓
Occupancy ADR (average daily rate) RevPAR (revenue per available room) Travellers Overnight stays
Monthly evolution: 2026, 2025 and 2023-2025 range
Málaga (province: includes Costa del Sol) PDF ↓
Occupancy ADR (average daily rate) RevPAR (revenue per available room) Travellers Overnight stays
Monthly evolution: 2026, 2025 and 2023-2025 range
Sevilla (province) PDF ↓
Occupancy ADR (average daily rate) RevPAR (revenue per available room) Travellers Overnight stays
Monthly evolution: 2026, 2025 and 2023-2025 range
Valencia (province) PDF ↓
Occupancy ADR (average daily rate) RevPAR (revenue per available room) Travellers Overnight stays
Monthly evolution: 2026, 2025 and 2023-2025 range
Bilbao (province of Bizkaia) PDF ↓
Occupancy ADR (average daily rate) RevPAR (revenue per available room) Travellers Overnight stays
Monthly evolution: 2026, 2025 and 2023-2025 range
San Bartolomé de Tirajana (Maspalomas and southern Gran Canaria) PDF ↓
Occupancy ADR (average daily rate) RevPAR (revenue per available room) Travellers Overnight stays
Monthly evolution: 2026, 2025 and 2023-2025 range
Benidorm PDF ↓
Occupancy ADR (average daily rate) RevPAR (revenue per available room) Travellers Overnight stays
Monthly evolution: 2026, 2025 and 2023-2025 range
Adeje (southern Tenerife) PDF ↓
Occupancy ADR (average daily rate) RevPAR (revenue per available room) Travellers Overnight stays
Monthly evolution: 2026, 2025 and 2023-2025 range
Occupancy ADR (average daily rate) RevPAR (revenue per available room) Travellers Overnight stays
Monthly evolution: 2026, 2025 and 2023-2025 range
Occupancy ADR (average daily rate) RevPAR (revenue per available room) Travellers Overnight stays
Monthly evolution: 2026, 2025 and 2023-2025 range
Arona (southern Tenerife) PDF ↓
Occupancy ADR (average daily rate) RevPAR (revenue per available room) Travellers Overnight stays
Monthly evolution: 2026, 2025 and 2023-2025 range
Torremolinos PDF ↓
Occupancy ADR (average daily rate) RevPAR (revenue per available room) Travellers Overnight stays
Monthly evolution: 2026, 2025 and 2023-2025 range
Occupancy ADR (average daily rate) RevPAR (revenue per available room) Travellers Overnight stays
Monthly evolution: 2026, 2025 and 2023-2025 range
Puerto de la Cruz PDF ↓
Occupancy ADR (average daily rate) RevPAR (revenue per available room) Travellers Overnight stays
Monthly evolution: 2026, 2025 and 2023-2025 range
Benalmádena PDF ↓
Occupancy ADR (average daily rate) RevPAR (revenue per available room) Travellers Overnight stays
Monthly evolution: 2026, 2025 and 2023-2025 range
Marbella PDF ↓
Occupancy ADR (average daily rate) RevPAR (revenue per available room) Travellers Overnight stays
Monthly evolution: 2026, 2025 and 2023-2025 range
Ibiza (Eivissa, city) PDF ↓
Occupancy ADR (average daily rate) RevPAR (revenue per available room) Travellers Overnight stays
Monthly evolution: 2026, 2025 and 2023-2025 range
Sant Antoni de Portmany (western Ibiza) PDF ↓
Occupancy ADR (average daily rate) RevPAR (revenue per available room) Travellers Overnight stays
Monthly evolution: 2026, 2025 and 2023-2025 range
Salou (Costa Daurada) PDF ↓
Occupancy ADR (average daily rate) RevPAR (revenue per available room) Travellers Overnight stays
Monthly evolution: 2026, 2025 and 2023-2025 range
Lloret de Mar (Costa Brava) PDF ↓
Occupancy ADR (average daily rate) RevPAR (revenue per available room) Travellers Overnight stays
Monthly evolution: 2026, 2025 and 2023-2025 range
In each card: top, monthly evolution by year (red line: 2026; dashed line: 2025; band: 2023-2025 range); bottom, year-to-date average compared with the same period in previous years (bars). Rises and falls within each year are the sector's own seasonality: peaks in spring and summer, lows in winter.
Source: INE (CC BY 4.0 licence). Latest published month, provisional.